
Simulation
Simulate the DNA in liposomes used in molecular robots.① Confirm the structural stability of the double-stranded DNA consisting of G rich single-stranded DNA and single-stranded input DNA used in the sensor, and ③ the structural stability of the DNA used in the actuator with NUPACK.
In addition, ② a reaction occurs using the DNA released from the sensor as input DNA to release the output DNA Thout_4VA, or ④ suppression of output by rutin input is simulated with Visual DSD.
①Sensor
In the double-stranded DNA consisting of G-rich single-stranded DNA and single-stranded input DNA, the G-rich portion reacts with potassium ions to form a G-quadruplex. This will narrow the hybridization region with the input DNA and destabilize the binding, resulting in the release of the input DNA.
The melting temperatures (Tm) of (1) double-stranded DNA and (2) double-stranded DNA with a narrowed region of the G-rich part and input DNA are measured. As a result, the Tm of (1) is 57°C, indicating that the structure is stable at room temperature (30°C). On the other hand, (2) did not form a duplex at room temperature. This suggests that the input DNA is not released at room temperature and that the input DNA is released by the formation of the G-quadruplex.
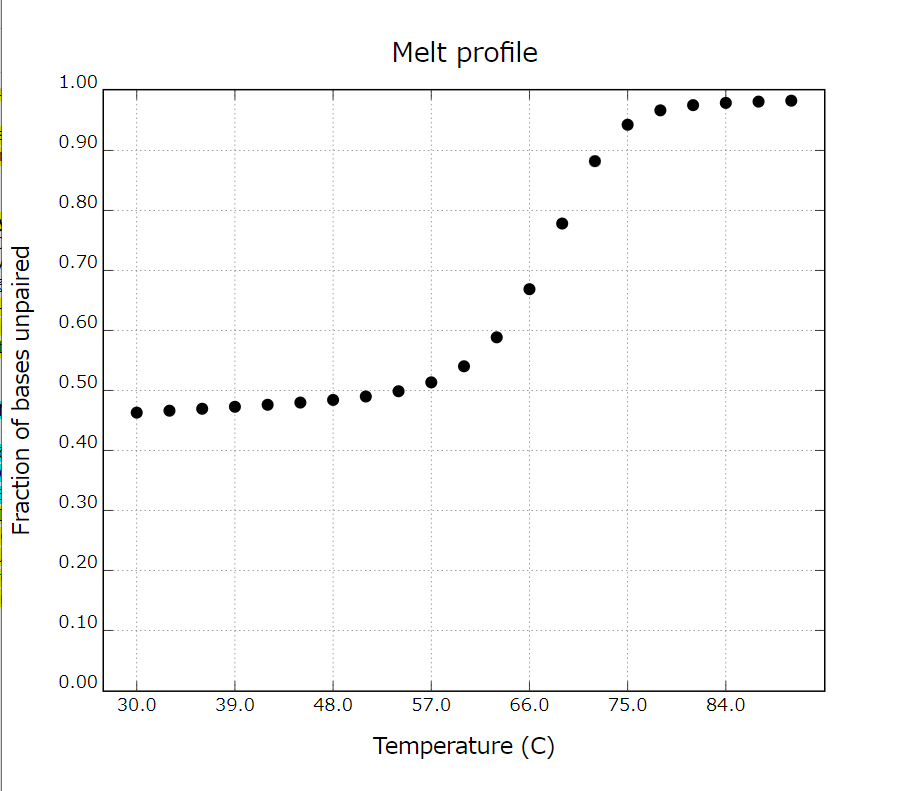
Fig 1. Melting temperature (Tm) of duplex DNA
②Processor
We simulated the behavior of the Processor with VisualDSD.
A portion of the trigger DNA in the previous section is Aout_4VA, and we designed a thresholding_4VA that releases the OutputDNA, namely Thout_4VA, when the concentration of Aout_4VA exceeds a certain level.
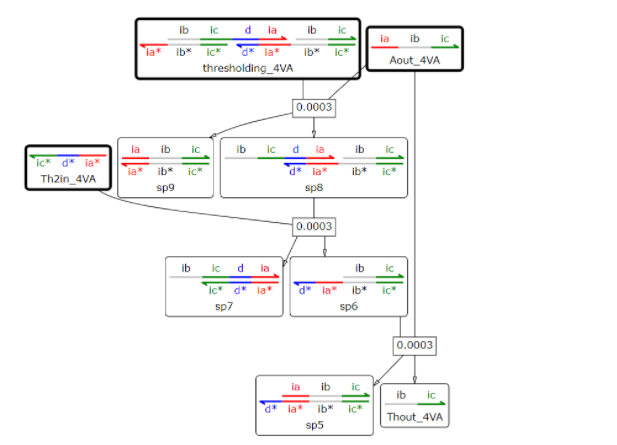
Fig 2. The reaction of Thresholding_4VA with one output of Thout_4VA at [Thout_4VA]:[ Th2in_4VA]:[Thresholding_4VA]=2:1:1
First, we used Thresholding_4VA, which combines [Thout_4VA]:[Th2in_4VA]:[thresholding_4VA] = 10:9:1 and outputs one Thout_4VA. The reaction rate was set to 0.0003, the duration of the experiment to 100000s, the concentration of Thresholding_4VA was set to 1nM, the concentration of Th2in_4VA was set to 15nM, and the initial concentration of each Aout_4VA was used to simulate how the concentration of Thout_4VA changes.
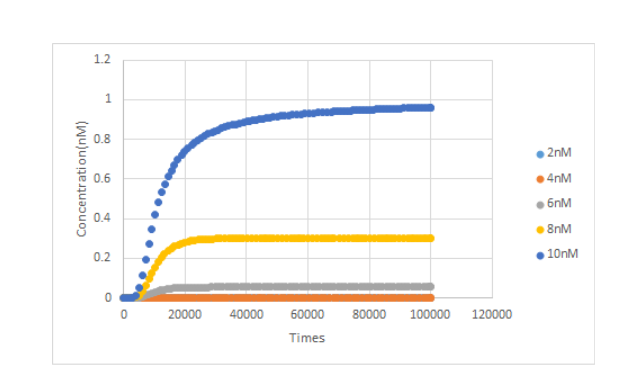
Fig 3. Concentration change of Thout_4VA at the initial concentration of each Aout_4VA
As a result of the simulation, when the initial concentration of Aout_4VA is low, Thout_4VA hardly outputs, and as the initial concentration of Aout_4VA increases, the concentration of Thout_4VA increases rapidly, so it may be used as a threshold.
Next, let's define thresholding_4VA to be thresholding_4VA(10), which reacts with [Thout_4VA]:[Th2in_4VA]:[thresholding_4VA]=10:9:1, and [Thout_4VA]:[Th2in_4VA]:[thresholding_4VA]=5:4:1 to react thresholding_4VA is set to thresholding_4VA(5).
When the reaction rate was set to 0.0003 for each thresholding_4VA and the duration of the experiment was set to 100000s, the concentration of Threshold_4VA was set to 1nM and the concentration of Th2in_4VA was set to 15nM. We simulated what value the concentration of Thout_4VA would be at 10000s
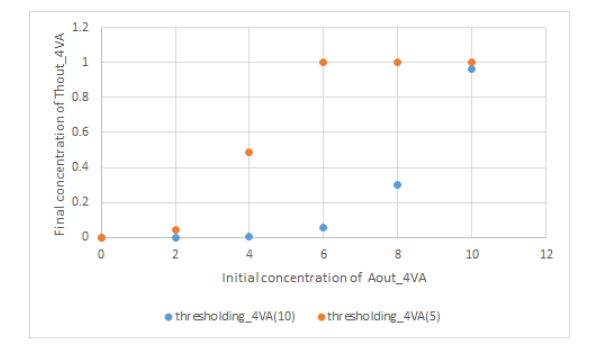
Fig 4. Concentration of Thout_4VA after 100000s at the initial concentration of each Aout_4VA in each case of thresholding_4VA(10) and thresholding_4VA(5).
As a result of the simulation, the initial concentration of Aout_4VA at which the concentration of Thout_4VA increases sufficiently is different in each case of thresholding_4VA(10) and thresholding_4VA(5). It seems that the threshold value can be set by setting the number of bonds of thresholding_4VA with Thout_4VA to an threshold value.
③Actuator
The sequence of the released Output DNA (Thout_4VA_ture) is as follows.
Output DNA : 5' AGGAAGA (CCCAAACAAACAAAACAA) GGACAT 3'
The part in parentheses () was not shown in the simulation in the previous section, but it had a hairpin structure.
In contrast, the PEG-single strand DNA of the PEG-double strand DNA bound to the Inner liposome membrane and the single strand DNA of the complementary strand have sequences that are not completely complementary.
Com strand : 5' GCT AGGAAGA
PEG-DNA : 3' TCCTTCT GGGTTTGTTTTGTT CCTGTA 3'
Since the output DNA released from the processor is completely complementary to the PEG-single-stranded DNA, a DNA strand substitution reaction occurs (3), releasing the PEG-DNA from the Inner liposome membrane and exposing the membrane fusion peptide. Then, the membrane fusion peptide exposed on the Inner liposome surface binds to the membrane fusion peptide inside the Outer liposome membrane, resulting in membrane fusion, and the rutin encapsulated in the Inner liposome is released from the Outer liposome.
Measure the melting temperature (Tm) of double-stranded DNA consisting of PEG-DNA and Output DNA as well as PEG-DNA and Com strand, to determine the stability of each structure at room temperature. The stability of each of them with temperature change is as follows. (Figure 5)
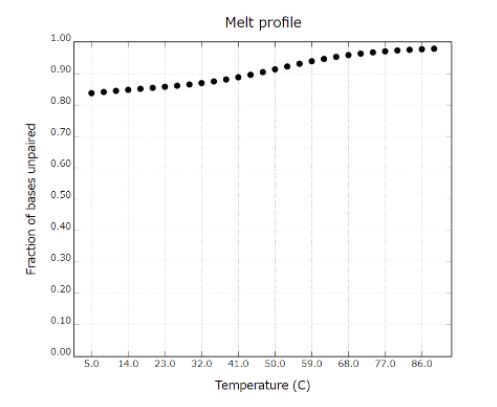
Fig 5. Melting temperature (Tm) of PEG-DNA and Output DNA
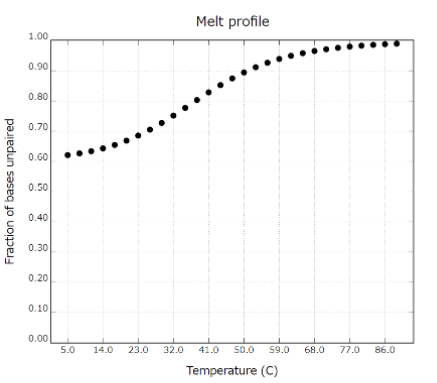
Fig 6. Melting temperature (Tm) of PEG-DNA and Com strand
From this result, we can predict that the strand substitution reaction occurs because PEG-DNA and output DNA, which have completely complementary structures, are more stable than PEG-DNA and Com strand.
Suppression of output DNA by input of rutin
We suppress the output DNA when we sense rutin to minimize the amount of rutin released. The input strand of rutin is Aout_rutin, and we tried to suppress the output of Thout_4VA of the 4VA threshold gate by turning it into the complementary strand of Th2in_4VA.
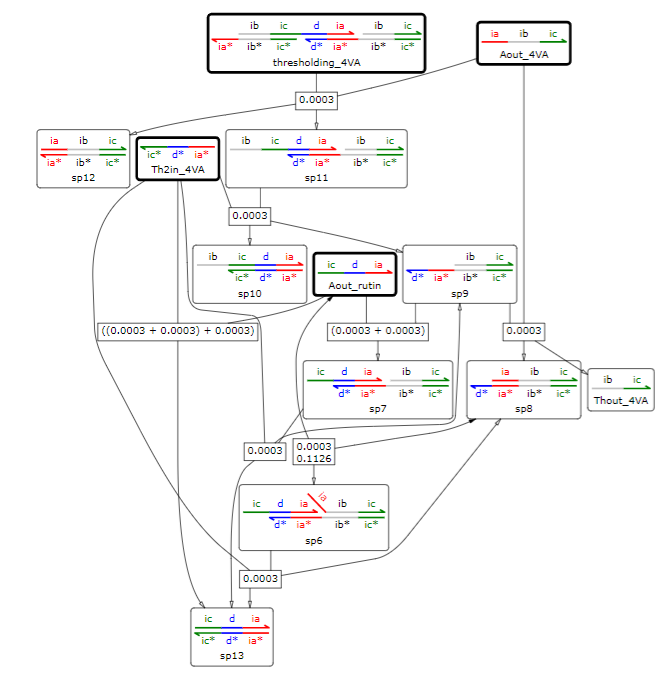
Fig 7. The suppression of the response by Aout_rutin in the threshold gate at Threshold_4VA such that Thout_4VA is 1 output when [Thout_4VA]:[ Th2in_4VA]:[Threshold_4VA]=2:1:1
In the simulation, we used thresholding_4VA, which outputs 1 Thout_4VA when [Thout_4VA]:[Th2in_4VA]:[Threshold_4VA] = 10:9:1. We set the reaction rate to 0.0003, the duration of the experiment to 100000s, and the concentration of Th2in_4VA to 1nM, Th2in_4VA to 15nM, and Thout_4VA to 10nM, and simulated how the concentration of Thout_4VA changes with each initial concentration of Aout_rutin.
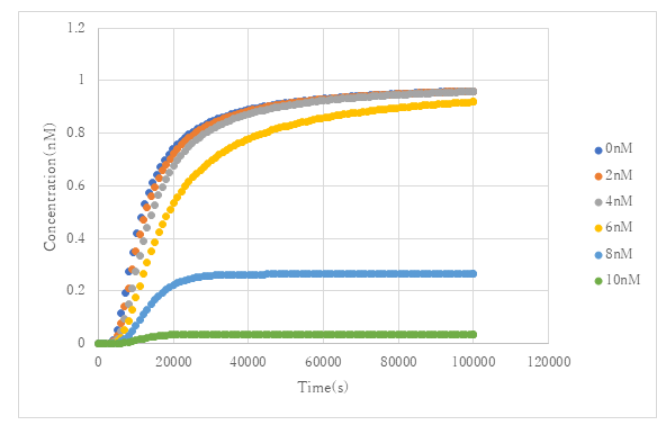
Fig 8. Concentration change of Thout_4VA at each initial concentration of Aout_rutin
The simulation results showed that the initial concentration of Thout_4VA decreased rapidly with the increase of the concentration of Aout_rutin. Therefore, the input of rutin is considered to be effective as an inhibitor of the reaction.
Next, we conducted an experiment using thresholding_4VA with one output of Thout_4VA as [Thout_4VA]:[Th2in_4VA]:[Threshold_4VA]=10:9:1. The reaction rate was set to 0.0003, the duration of the experiment was set to 100000s, the concentration of thresholding_4VA was set to 1nM, and the concentration of Thout_4VA was set to 10nM. Then, we simulated the value of the concentration of Thout_4VA at 100000s depending on the initial concentration of Aout_rutin when the initial concentration of Th2in_4VA was 15nM or 12nM.
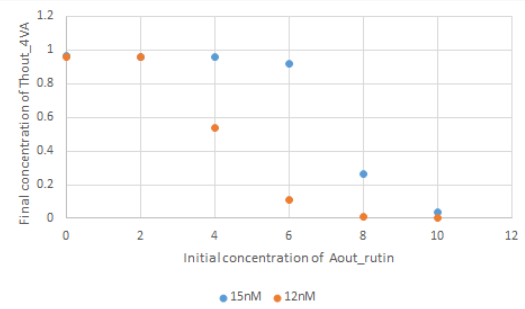
Fig 9. Concentration of Thout_4VA after 100000s at each initial concentration of Aout_4VA for the cases of 15nM or 12nM initial concentration of Th2in_4VA.
The simulation results showed that the concentration change of Aout_rutin when the concentration of Thout_4VA decreases rapidly, depends on the initial concentration of Th2in_4VA.Therefore, it seems possible to set the threshold for the suppression of Thout_4VA output by rutin through adjusting the initial concentration of Th2in_4VA.
Reference
Visual DSD
NUPACK
Excel